ERP built for small
to large businesses
An affordable, easy-to-use ERP software combining Finance, Sales, Inventory, CRM, and Reporting in one. SAP Business One helps small and mid-sized companies streamline operations, improve visibility, and make smarter decisions.
FREE DemoBOOK A CONSULTATION


The Scalable ERP Solution for Growing SMEs
SAP Business One Cloud ERP should be your first choice If you want to bring your whole team onto the same page with a secure, scalable and globally-recognised ERP solution.
Perfect for small-to-medium enterprises that need an adaptable platform for growth, SAP Business One Cloud helps you create a business environment that hums with efficiency.
Streamline and automate processes and uncover critical information to enhance your operations, customer experience and cash flow.
Is SAP B1 right for your business? We can help you decide.

An Enterprise ERP Solution You
Can Trust
Why Choose SAP Business One ERP Software?
Capture and coordinate everything in one feature-rich yet intuitive system to avoid wasted time, money, and effort. SAP Business One cloud ERP system delivers uncomplicated end-to-end management of finances, purchasing, inventory, production, distribution, sales, CRM, service and analytics.
Why growing SMEs invest in SAP Business One
Growing businesses typically reach a point where spreadsheets and disconnected systems limit visibility and control. SAP Business One helps organisations:
- Gain clear oversight of cash flow, margins, and performance
- Eliminate duplicated data entry and manual reconciliations
- Improve decision-making with accurate, real-time information
- Standardise processes across departments
- Create a foundation for sustainable, long-term growth
Stand undivided, become future-focused
Eliminate silos, get a consolidated view of performance and effortlessly trigger cross-functional workflows that make it easier to deliver exactly what your customers want, when they want it.
Unlike legacy systems of old, SAP B1 is an enterprise solution designed to remain relevant and underpin growth over the long-term. It’s built on open and extensible technology.
Partner with us to implement SAP B1 and you’ll be more unified, methodical and confident about reaching strategic goals and investing in new initiatives.

Don’t take our word for it
Read more reviews
Top features of SAP B1 Cloud
SAP Business One Cloud provides the core capabilities growing small and midsize businesses need — combining financial management, real-time analytics powered by SAP HANA, production and distribution control, and integrated CRM in one secure, scalable platform.
Some of the standout functionality available with SAP Business One includes:
SAP HANA
SAP HANA for SAP B1 is an in-memory database that delivers quick processing and speed of reporting that your business will find invaluable.
Financial management
Financial management as a core component, ensuring consolidated costs and profits are accurately captured and accounting processes are simplified.
Analytical portal
Analytical portal powered by HANA allows you to get instant access to information via reporting dashboards, KPIs and forecasting tools including customisable options.
Production and distribution
Production and distribution modules ensure resources are maximised in the manufacture, warehousing and delivery of goods to satisfy customers.
CRM and Service
CRM and Service modules that provide a single customer view at every stage of the buying journey and beyond to help you generate revenue and loyalty.
Success Stories with Leverage Technologies
From finance to fulfillment, we bring every part of your business together with connected, intelligent systems.
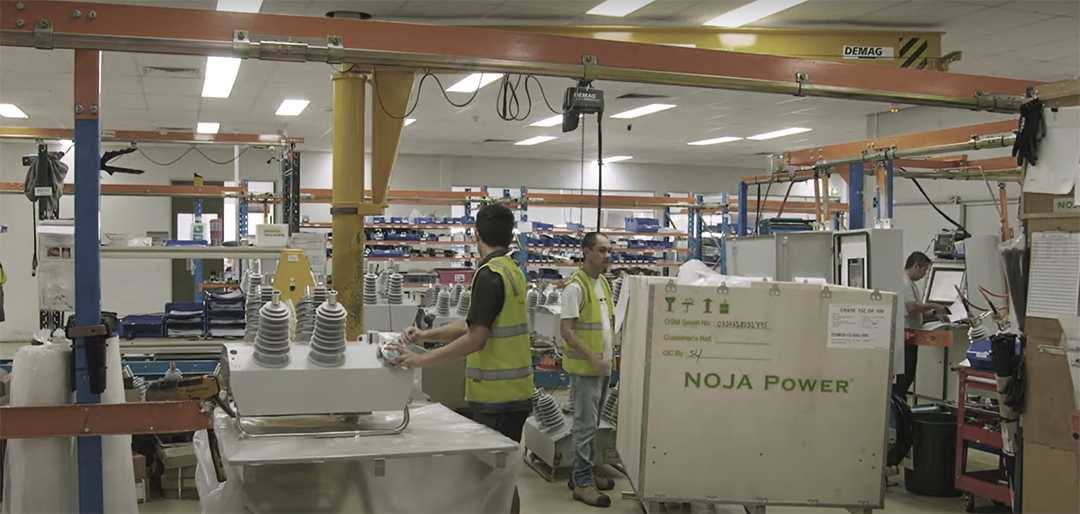
Manufacturing & Engineering
NOJA Power also uses the many SAP Business One functionalities extensively to make data entry as simple and reliable as possible for the staff. Where they previously entering data multiple times, the team now enters it once.
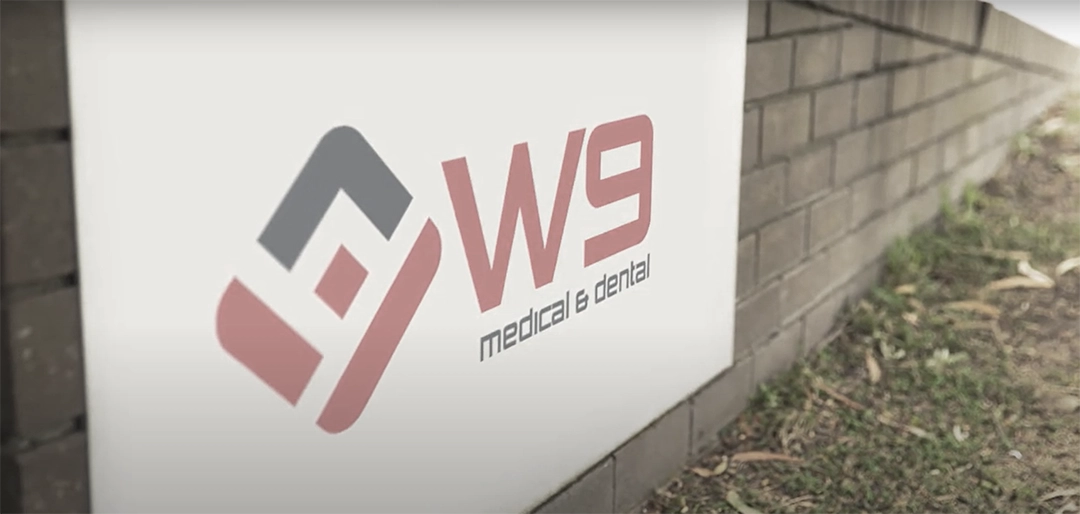
Wholesale Distribution
SAP B1 supports serial and batch tracking of our products. As a healthcare and medical distributor, that was very important to us. With software that scales as we grow, we integrated two additional companies that we started.

Wholesale distribution
SAP B1 offers a clearer picture of every step in the company’s supply chain, internal processes, and customer relationships. They opted for the cloud-based version so they can securely access insights from SAP B1 from anywhere, anytime.
Recognised by the top ERP Partners in Australia

Leverage Technologies is an SAP Gold Partner, Sage Platinum Partner, and MYOB Acumatica Platinum Partner. Our award-winning team has earned national recognition for excellence in ERP and our commitment to customer success.
Discover more about SAP Business One Cloud
Want to know more about SAP Business One Cloud? Contact the SAP Business One team at Leverage Technologies.