The real strength behind SAP Lumira is that it is a self-service business intelligence (BI) tool for SAP Business One. Self-service because you can prepare, create and share your own reports without the need for external consultants or IT department / technical assistance. SAP Lumira goes beyond reporting into business intelligence and analytics as SAP Lumira enables the user to slice and dice data with dynamic visualisations.
SAP Lumira allows users to import (prepare) data from various sources including MS Excel, SAP Business One HANA and SAP Business One SQL databases and other sources. Once imported the SAP Lumira framework provides the user with simple mechanisms for reporting:
Measures – typically numeric values ($ value or quantity),
Dimensions – for example item codes, item groups, date ranges and region.
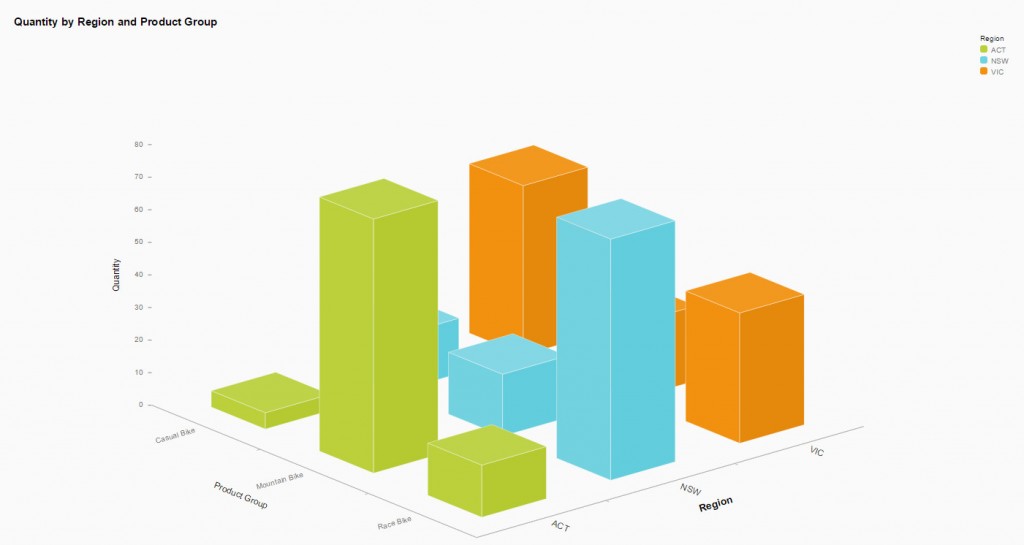
Users can choose from multiple reporting graphical types including:
- Bar and column charts (with multiple different types available including 3d charts),
- Line charts,
- Pie charts,
- Geographic charts – to chart your sales by region / city,
- Heat maps and more……
Users can drag measures and dimensions into the X and Y axis to create different report types and analysis.
There are a number of advanced features available like predictive analysis using SAP Predictive Analytics to forecast future trends based on historical data.
These visualisations can then be created into a storyboard (set of visual reports with commentary) which can then be shared with team members.
These features are best demonstrated through a SAP Lumira product demonstration.
SAP Lumira Product Demonstration:
Recognised by the top ERP Partners in Australia

Leverage Technologies is an SAP Gold Partner, Sage Platinum Partner, and MYOB Acumatica Platinum Partner. Our award-winning team has earned national recognition for excellence in ERP and our commitment to customer success.

Brett has more than 20 years of business software sales and company management experience. Brett has been involved in more than 300 ERP projects. His passion is customer satisfaction, making sure every client is more than just satisfied. Brett wants our customers to be driven to refer their friends and peers because we offer the best services and technology available and because we exceeded their expectations.