SAP Business One offers several great reporting options. Let’s explore in some detail one of the most useful, easy to use and powerful SAP Business One reporting options – MS Excel pivot tables integrated to SAP Business One. Assuming what you want is quick access to information with slice and dice type functionality across any key functional area in SAP Business One then read on. We all know and have used MS Excel. Pivot tables allow you to summarise, sort, add, count, drag and drop information in the familiar MS Excel format. There are two major steps to creating pivot tables using SAP Business One reporting source data – 1. Define your data source (SAP Business One) 2. Create your pivot table in MS Excel
Let’s follow the process of creating a basic pivot table in SAP Business One reporting.
Step 1 – Open MS Excel. Go to the “Insert” tab and click on Pivot table.
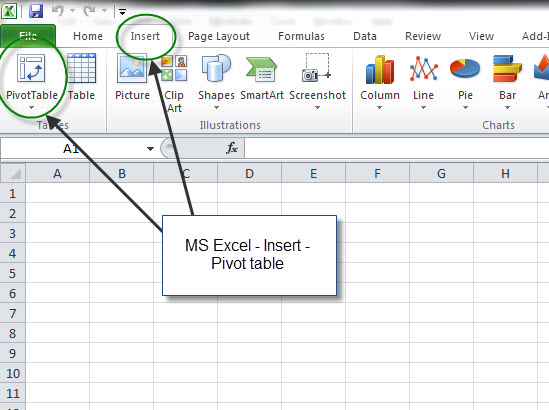
Note that you can create a pivot table or pivot chart (pivot table with graphics).
Step 2 – Select your data source. In this instance we will select an external data source by clicking on the “use external data source” in MS Excel.
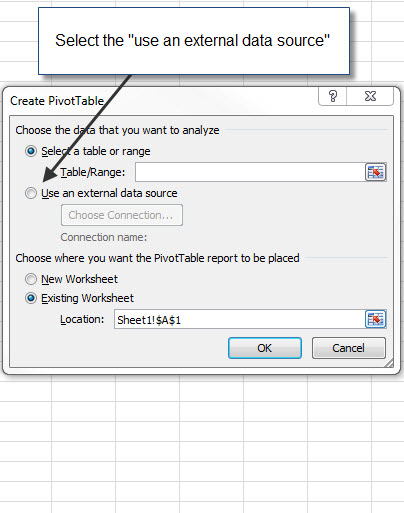
Once you have selected your external data source you will need the relevant security access to the MS SQL database for SAP Business One. Once connected to the SAP Business One reporting data source you will be able to select the tables from which you want to report in SAP Business One. Let’s not forget that SAP Business One reporting is made easier by using the “system information” tab in SAP Business One. This will assist you to choose the correct table and field names for your report (see last week’s blog – SAP Business One Reporting – choosing the correct table names).
Once you have selected the table names for your SAP Business One reporting, you will be able to select the fields that you want to include in your SAP Business One reporting pivot tables.
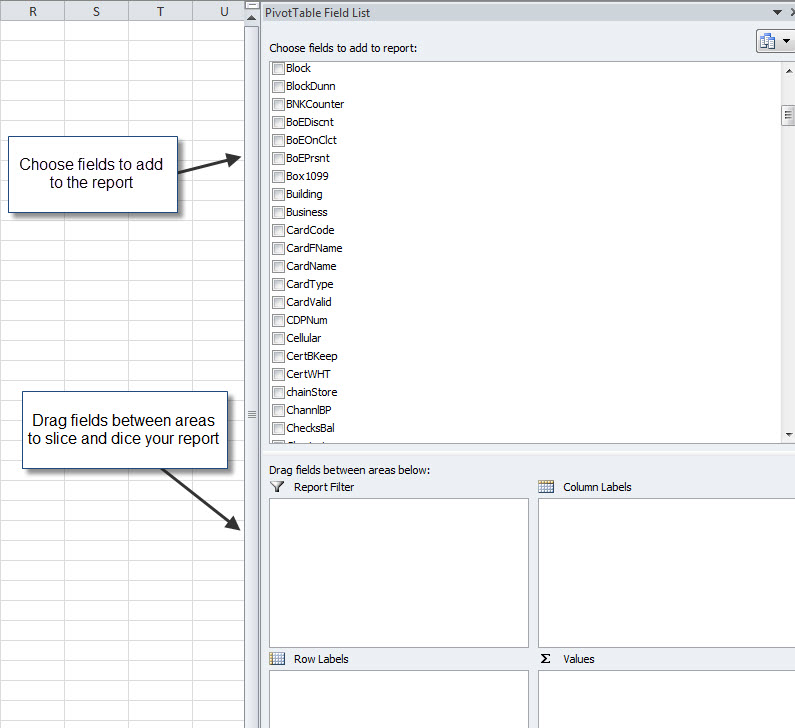
Now that the SAP Business One field names are available to you in MS Excel, you can click and choose the field names that you want included in your report. You can drag fields between the report filter, row labels, values and column labels areas to get the report layout that you require. Your SAP Business One report can be easily filtered based on your specific requirements.
What we have shown in this blog is a very simplistic look at SAP Business One reporting using MS Excel pivot tables. Once you learn to use pivot tables and MS SQL you can write advanced reports using data from multiple tables. The team at Leverage Technologies has written MS Excel pivot table reports for Profit and Loss, Balance Sheet, debtors ageing, sales and operational reporting.
The benefits of SAP Business One reporting using MS Excel pivot tables are :
- Inexpensive reporting option
- Easy to use
- Quick to learn
- Has slice and dice type functionality
- Graphical capability
- Reports can refresh automatically or at the click of a button
- Reports directly from the SAP Business One database
- No need to re-key or manually capture data
With some practice and training you can write your own SAP Business One reports using MS Excel pivot tables. Good luck – if you need any help feel free to contact the team at Leverage Technologies.
Recognised by the top ERP Partners in Australia


Leverage Technologies is an SAP Gold Partner, Sage Platinum Partner, and MYOB Acumatica Platinum Partner. Our award-winning team has earned national recognition for excellence in ERP and our commitment to customer success.

Brett has more than 20 years of business software sales and company management experience. Brett has been involved in more than 300 ERP projects. His passion is customer satisfaction, making sure every client is more than just satisfied. Brett wants our customers to be driven to refer their friends and peers because we offer the best services and technology available and because we exceeded their expectations.