Dashboards, KPIs and MS Excel Pivot tables – do it yourself reporting with SAP Business One HANA
This is part two of our blog and YouTube posting about writing your own reports in SAP Business One. In part one of this blog we discussed writing queries using the Query Generator. Now let’s consider dashboards, KPI’s and MS Excel Pivot table reporting for SAP Business One.
Dashboards, KPIs and pivot tables can be created in the MS SQL Server or the SAP HANA version for SAP Business One. There are specific features associated with pervasive analytics and interactive analysis that are only available in the HANA version of SAP Business One. I want to focus this discussion on the HANA pervasive analytics and interactive analysis because the HANA version of SAP Business One takes self-service (write your own reports) to a whole new level. Let’s take a more detailed look at what’s available:
KPI’s and dashboards: SAP Business One HANA offers a number of standard KPIs and dashboards that a user can immediately add to their HANA interface.
To add or create additional KPI’s and Dashboards (SAP Business One HANA):
1. Open up SAP Business One HANA Pervasive Analytics.
You will notice a number of standard KPIs and dashboards that are really useful. There are about 40 standard KPIs and Dashboards to choose from. Examples include:
- Total sales amount
- Purchase analysis
- Top 5 customers by sales amount
- Stock turnover
- Sales opportunity count
SAP Business One HANA – Pervasive Analytics:
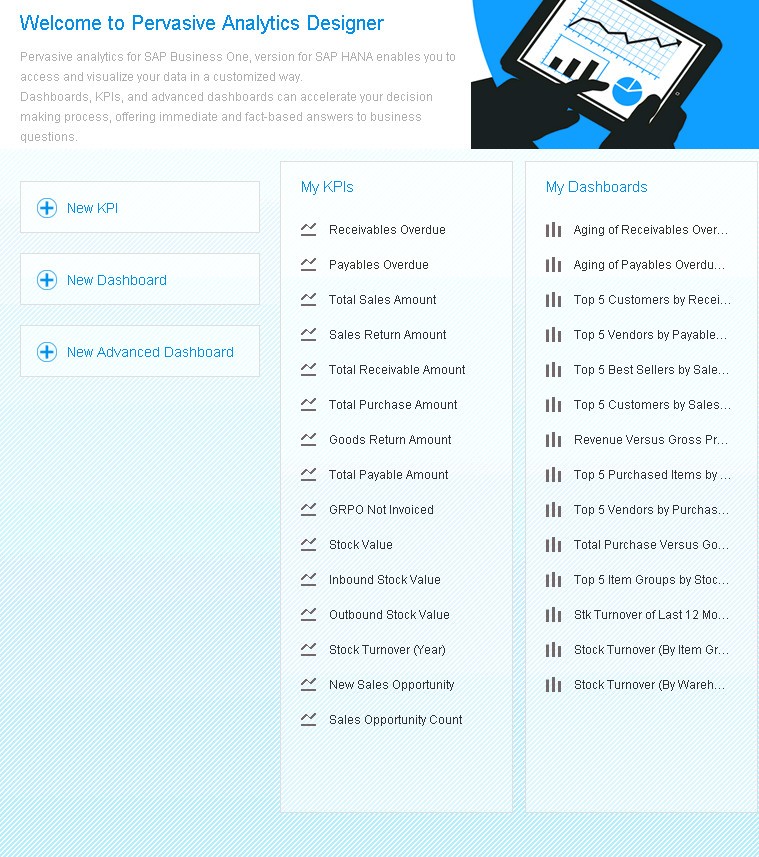
2. Decide whether you want a standard KPI / dashboard or you want to create your own. If you choose a standard KPI or dashboard simply choose the one you want and add it to the list.
3. If you want to write your own KPI or dashboard: When you log into SAP Business One HANA pervasive analytics you have access to three options – New KPI, New Dashboard and New advanced dashboard. Let’s consider the KPI and Dashboard options. Remember that our focus is on the ability for you to write your own KPI’s and Dashboards. As an example let’s write our own sales KPI. Click on the “New KPI” button, then click on Analytic view and sales revenue analysis. SAP Business One HANA pervasive analytics now opens up a number of fields that you can use in your new, user created KPI. Simply drag the fields that you want to report on into the relevant KPI value and KPI date dimension areas.
SAP Business One HANA – KPI Designer: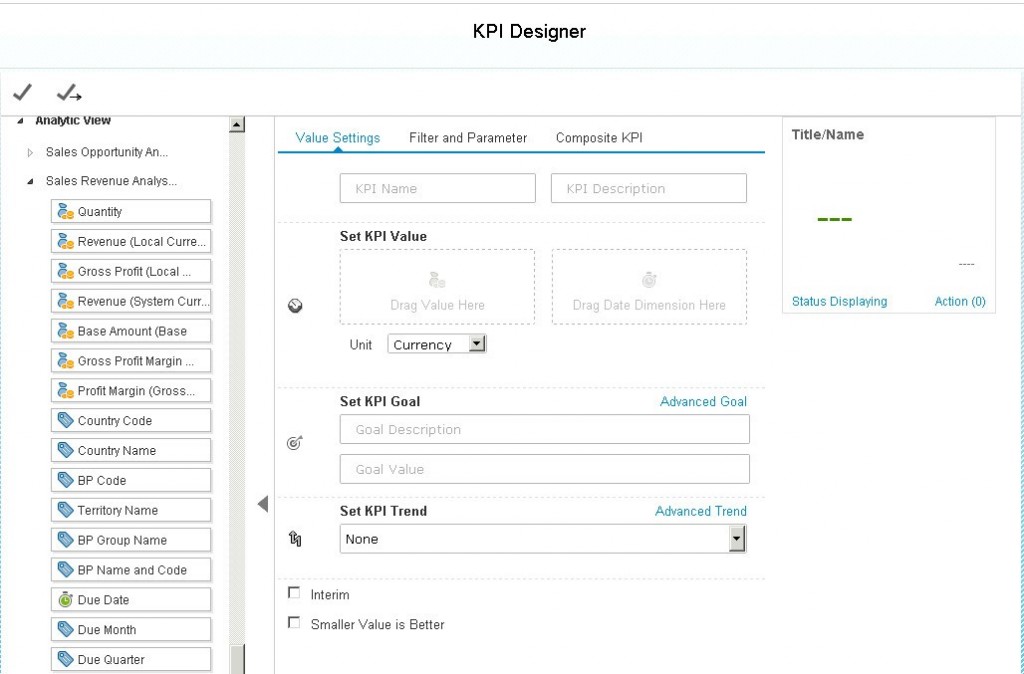
The ability to design your own KPIs and Dashboards is best demonstrated in a video.
SAP Business One HANA – Pervasive Analytics – Creating your own KPI’s and Dashboards:
SAP Business One also offers Interactive Analysis – the ability to build your own pivot table reporting without any prior technical knowledge of the SAP Business One datasets. Once again SAP has done the hard work for the user by making the relevant fields available in pivot table format. The user simply has to drag and drop the information they want into the report format.
Thanks to the team at SAP and SAP Business One HANA – self-service reporting is available here and now.

Brett has more than 20 years of business software sales and company management experience. Brett has been involved in more than 300 ERP projects. His passion is customer satisfaction, making sure every client is more than just satisfied. Brett wants our customers to be driven to refer their friends and peers because we offer the best services and technology available and because we exceeded their expectations.