SAP Lumira Geographical Reporting for SAP Business One
16 Nov 2015 | by NatalieSAP Lumira offers a self-service business intelligence tool that can be used by team members to write their own reports. Source data can be SAP Business One, SAP HANA, csv files, MS Excel and other related sources.
There are multiple great features in SAP Lumira but today I was using the geographical reporting and I was so impressed with the standard functions and features that I felt compelled to blog about it.
SAP Business One and Lumira – Geographical Reporting at the click of a button:
Most Leverage Technologies customers will be using SAP Business One and the good news is that SAP Lumira has standard interfaces to SAP HANA and SAP SQL Server databases for SAP Business One. As a result data gathering from your SAP Business One system is easy.
There are multiple reporting options in SAP Lumira – bar chart, column chart, pie chart, line chart, area chart, scatter plot, heat maps and more. Today let’s focus on the geographical reporting.
Geographical reporting will typically be used when you have multiple branches in different states and cities and you want to map your sales, purchasing, profitability and other data by region or city.
Let’s see how this geographical reporting in SAP Lumira works:
Your sales data will have some form of geography associated with the reporting elements (city, region, state etc.). As an example your sales might be broken down by state and city:
- NSW – Sydney
- NSW – Newcastle
- QLD – Brisbane
- VIC – Melbourne
One of the great features of SAP Lumira is that once data is imported the geography field (region for example) appears as a dimension for reporting in the SAP Lumira visualization toolsets.
To enable the geography fields for reporting simply go to the City or Region fields in the dimensions area of SAP Lumira. Click on the settings area and then click on the “Create a geographic hierarchy”. SAP Lumira will ask if you want to create the hierarchy by name or by latitude / longitude.
SAP Business One Lumira Geographical Reporting: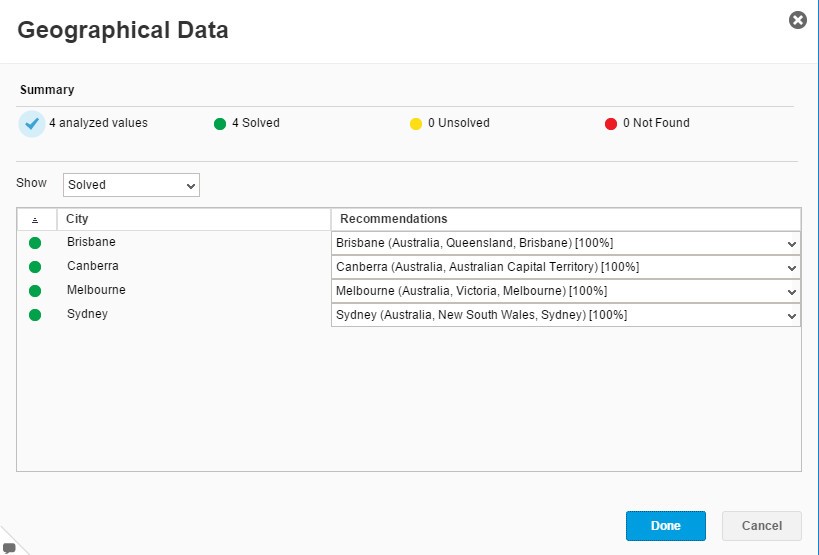
Once created you can simply drag and drop the information that you want onto one of the standard SAP Lumira Geographical reports. Multiple report options are available:
- Geo Bubble Chart,
- Geo Choropleth Chart,
- Geo Pie Chart,
- Geo Map.
Check out our latest Geo Mapping for SAP Lumira YouTube demonstration:
SAP Lumira Geo Mapping is easy to use and delivers powerful reporting for your sales, purchasing and management team.
Download your demo copy today https://www.sapstore.com/solutions/99008/SAP-Lumira


Leave a comment