SAP Business One – writing your own reports – SAP Lumira – Self Service Business Intelligence
11 Nov 2015 | by NatalieSAP Business One – Create Your Own Reports – part 3
This is part three of our blog and YouTube series focused on writing your own reports in SAP Business One. Part one focused on the SAP Business One Query Generator, part two we looked at using SAP Business One HANA to write your own dashboards, KPI’s and MS Excel Pivot Tables. Now let’s discuss SAP Lumira – the ability to run self-service (do it yourself) Business Intelligence (BI) for SAP Business One.
SAP Lumira Self Service Business Intelligence for SAP Business One:
SAP Lumira allows users to:
- Import data from multiple data sources:
- SAP Business One SQL,
- SAP Business One HANA,
- MS Excel,
- Clipboards and more…….
Data import is really easy and does not require IT skillset. Simply connect to the relevant SQL or SAP HANA database or spreadsheet, enter the password and your data is imported with a few clicks.
- Visualise your data:
- Multiple different report formats,
- Standard date / time hierarchy reporting,
- Standard geographical reporting,
- Forecasting,
- Drag and drop measures and dimensions for quick, easy visual analysis.
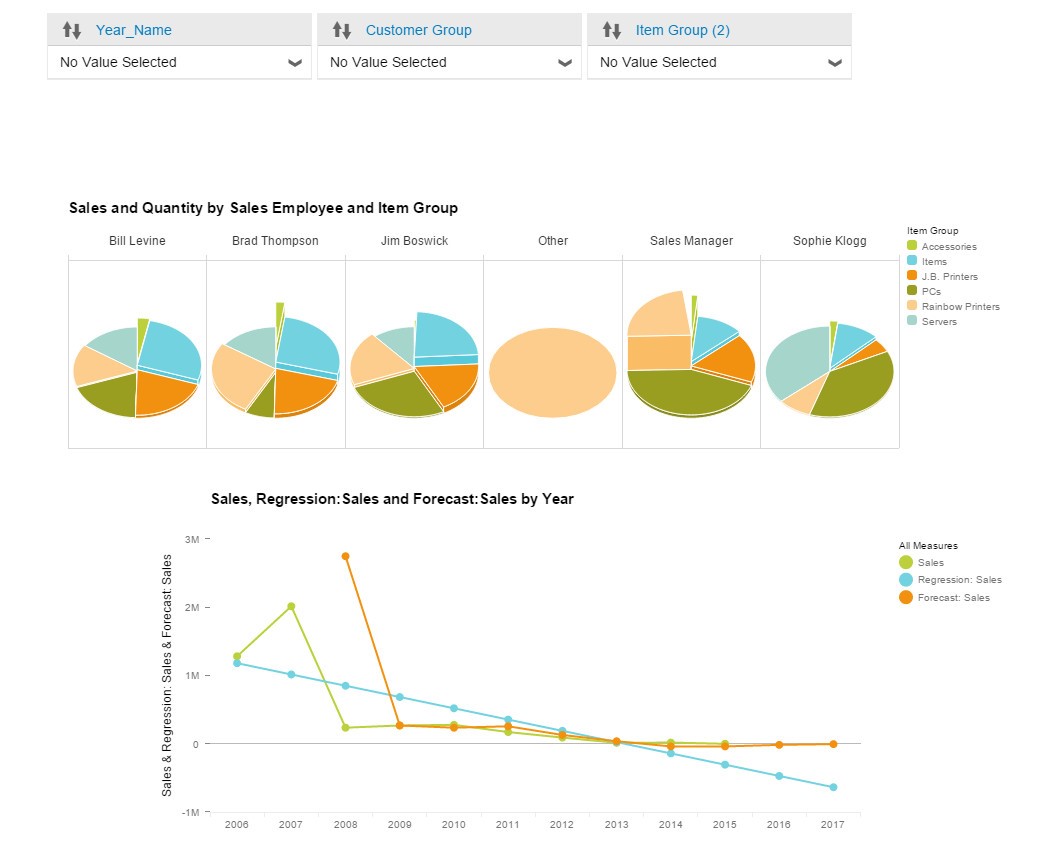
The visualization of your data allows for easy graphical or grid based views of your data. A user can slice and dice data by multiple measures (for example gross profit, revenue value, quantity of sales etc.). Data can also be viewed by dimension (for example product group, brand, city, state, salesperson). It is the easy drag and drop nature of this reporting that sets SAP Lumira aside from the competition.
- Tell your story with SAP Lumira Storyboards:
Take your SAP Lumira visualisations and create storyboards to tell your story and share your reports. Think of the possibilities – if you have a Monday morning sales meeting why not create a storyboard for your team that has an overview of multiple relevant data views and visualisations for the sales team. As an example you might include the following relevant visualisations in your sales storyboard:
- Sales YTD vs Budget,
- Sales MTD vs Budget,
- Sales by product group,
- Sales by region / territory,
- Sales by customer,
- Sales by item group (and by customer).
These visualisations can be added to a single or multi page storyboard with commentary and explanations.
SAP Lumira – Reporting for SAP Business One:
- Now share your storyboard with your team – either through the cloud or through other publishing mechanisms or exports.


Leave a comment